Statistics and Analytics
Site statistics show detailed analytics about how many visitors your site gets, where they are coming from, and which pages they have visited. Analysing this customer information can help you make more informed decisions to improve your site and your business.
We record and display full statistics for your site, per device, so you can view exactly what users are doing on desktop, tablet, and mobile.
To view all of your stats, from the dashboard, click Stats on the left menu or top navigation bar.
If you are not seeing any statistics, likely a user has not yet visited the site.
NOTES:
- Stats take 24 hours to update.
- CCH Web Manager stats are separate from Google Analytics stats which you can log into as usual with your Google Analytics credentials.
Site Visits
The number of total site visits is listed, with desktop and mobile visits specified, to the right. The total site visits compared to the trend from the previous time period is displayed on the graph. Select a time frame from the drop-down to see a graph of the visits to your site over time. To see more statistics, click Open Full Stats.

Engagement
On the Stats card, click Engagement to see information about engagement actions being taken on your site. Only widgets installed on your site will display. You will see up to four engagements from the list below:
- Click to Call
- Form Submission
- Click to Email
- Click to Map
- Click to Share
- Click to Text

To see more statistics on engagement, click Open Full Stats.
Open Full Stats
Stats Selection
At the top of the page select a time period you would like to see stats for.
Stats Tabs Summary
The various stats fields in the stats dialog display different information about the site.
Summary of the stats details.
Breakdown of visits according to pages.
Visitors by device, as well as information about visits and page views.
Ways that visitors got to the site.
Which browsers and operating systems visitors were using.
Where visitors were in the world when they visited.
Track click-to-call, click-to-email events and more
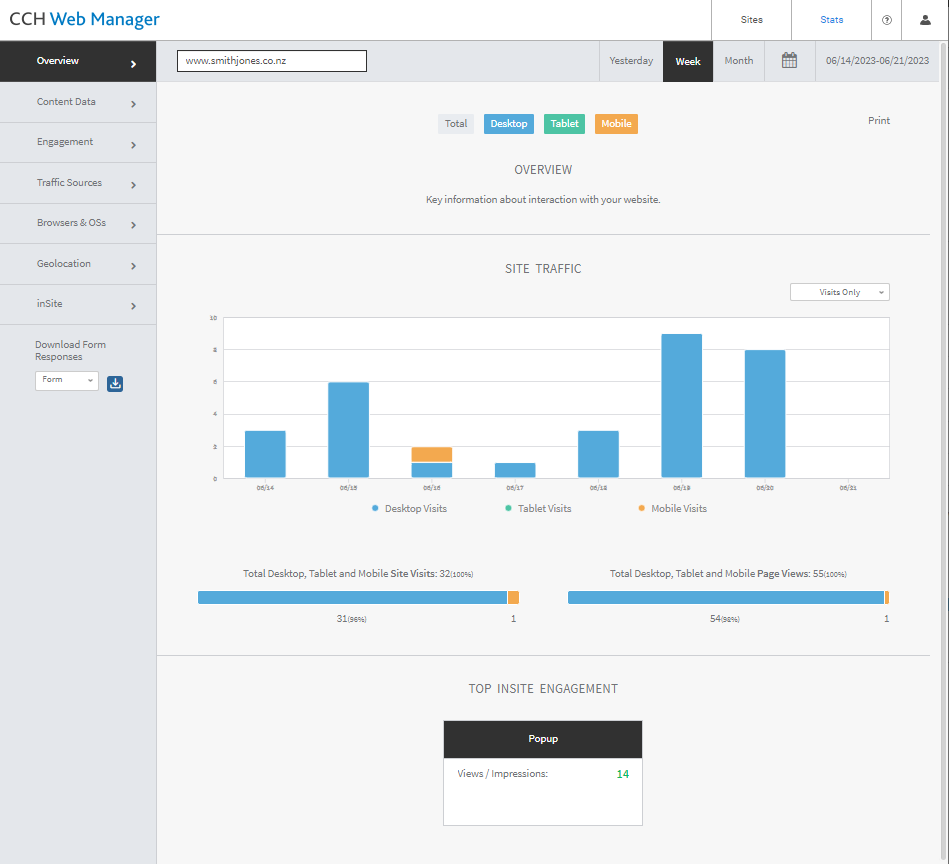
Overview
In the left panel, click Overview to see key information such as user interaction and total visits to your site. This allows you to ensure your site is healthy and active.
To print the overview stats, on the right side, click Print. To save as a PDF, select Save as PDF from the Destination drop-down in the Print dialog.
NOTE: Only overview stats can be downloaded as a PDF.
Content Data
In the left panel, click Content Data to see the pages that are visited the most. Based on your site's layout, this provides information about what your visitors are searching for. If they visit a page more often than another, you may consider making that page more engaging or informative.
Engagement
In the left panel, click Engagement to see a deep view of the exact actions your users take, such as click to call. This information allows you to further optimize your site so visitors take advantage of your business features more often and effectively.
Traffic Sources
In the left panel, click Traffic Sources to see information about how visitors are accessing your site. Do most visitors type in your address directly? Or do they find you by search? This can affect how you run your marketing and site in many ways. For example, if search traffic is low, try targeting new or more relevant keywords.
Direct traffic indicates when someone types in your site URL to access your site directly. Referral traffic indicates when a visitor clicks a link from another site to access your site. Organic traffic indicates when your site was found on a search results page.
Browsers & OSs
In the left panel, click Browsers & OSs to see what type of browser and operating system your site visitors are using.
Geolocation
In the left panel, click Geolocation to see the Country, State, and City your visitors are located in when they visit your site. The more you know about your visitors, the more you can provide relevant and engaging information when they visit your site.
Advanced Event Statistics
We track multiple events. The following events display in your analytics dashboard:
- Click-to-Call
- Click-to-Email
- Click-to-SMS
- Mobile Map
- Form submissions
When adding a Google Analytics ID to a site, these events are automatically tracked in your Google Analytics account as well.

